
This research is a joint effort conducted by Omri Ben-Bassat from Intezer and Itay Cohen from Check Point Research.
Prologue пролог
If the names Turla, Sofacy, and APT29 strike fear into your heart, you are not alone. These are known to be some of the most advanced, sophisticated and notorious APT groups out there, and not in vain. These Russian-attributed actors are part of a larger picture in which Russia is one of the strongest powers in cyber warfare today. Their advanced tools, unique approaches, and solid infrastructures suggest enormous and complicated operations that involve different military and government entities inside Russia.
Russia is known to conduct a wide range of cyber espionage and sabotage operations for the last three decades. Beginning with the first publicly known attacks by Moonlight Maze, in 1996, the Pentagon breach in 2008, Blacking out Kyiv in 2016, hacking the United States elections in 2016, and including some of the largest, most infamous cyberattacks in history, targeting an entire nation with NotPetya ransomware.
Indeed, numerous Russian operations and malware families were publicly exposed by different security vendors and intelligence organizations such as the FBI and the Estonian Foreign Intelligence Services. While these discoveries shed light into specific Russian actors or operations, the larger picture remains hazy.
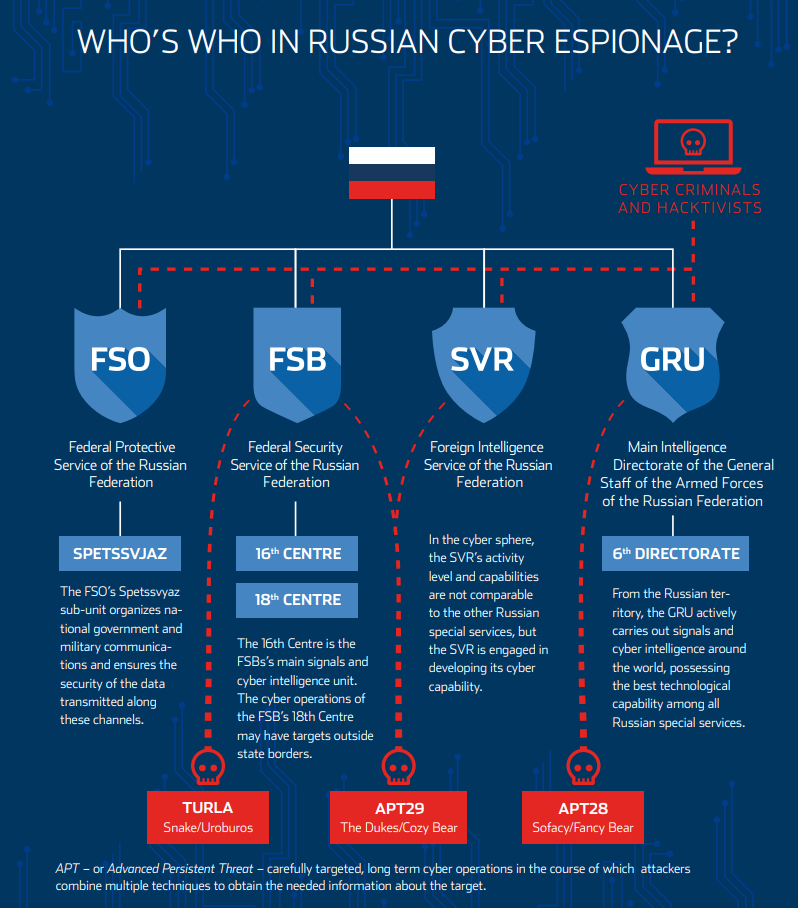
Figure 1: An infographic that was published in a report by the Estonian Foreign Intelligence Service
The fog behind these complicated operations made us realize that while we know a lot about single actors, we are short of seeing an entire ecosystem with actor interaction (or lack thereof) and particular TTPs that can be viewed on a larger scope. We decided to know more and to adopt a broader perspective. This led us to gather, classify, and analyze thousands of Russian APT malware samples in order to find connections not only between samples, but also between different families and actors.
During this research, we analyzed approximately 2,000 samples that were attributed to Russia and found 22,000 connections between the samples, in addition to 3.85 million non-unique pieces of code that were shared. We classified these samples into 60 families and 200 different modules.
Key Findings ключевые результаты
- This research is the first and the most comprehensive of its kind.
- For the first time, thousands of samples were gathered, classified, and analyzed in order to map connections between different cyber espionage organizations of a superpower country.
- In most cases, the Russian actors do not share code with one another.
- While each actor does reuse its code in different operations and between different malware families, there is no single tool, library or framework that is shared between different actors.
- Every actor or organization under the Russain APT umbrella has its own dedicated malware development teams, working for years in parallel on similar malware toolkits and frameworks. Knowing that a lot of these toolkits serve the same purpose, it is possible to spot redundancy in this parallel activity.
- These findings may suggest that Russia is investing a lot of effort into its operational security.
- By avoiding different organizations re-using the same tools on a wide range of targets, they overcome the risk that one compromised operation will expose other active operations.
- We were able to verify previously reported connections between different families, supporting these connections with code similarity analysis as evidence.
- We are releasing several tools to be used by the research community.
- An interactive map of connections between dozens of Russian APT families and their components.
- A signature-based tool to scan a host or a file against the most commonly re-used pieces of code leveraged by the Russian APTs.
For the complete list of findings and their meaning, please refer to the extended results section.
Getting Started ачинаем
Our journey into this complex ecosystem began, as any thorough research, with one question. To be honest, it wasn’t a single question, but several of them:
What information is already publicly available? What, if any, previous research of this type been conducted before? Who are the actors in the Russian APT ecosystem? What are the malware families used by these actors? Who are the targeted victims? What connections were already found between different actors, families, and samples? And more…
This led us to a deep background reading of public information that was shared by other researchers, vendors, and governments. Without the previous research conducted by these individuals, and without this information we would’ve been lost, so this is the time to say thank you.
After days of reading background materials and publications, it became more clear to us on how we should proceed. To put it simply, we split the research into four steps:
1. Gathering samples
2. Classifying the samples
3. Find code similarities between the samples
4. Analyze the identified connections
In the chapters below, we will try to explain each of these steps. We will describe what we have done, how we did it, and what challenges we encountered. If you are not interested in the technical aspects of the research and want to jump straight to the detailed results, please click here.
Gathering Samples сбор образцов
The first step was to gather samples that we know were attributed to malware families that are associated with official Russian actors. We began by listing the names of the actors and families we read about previously. We searched for technical reports that were published about these names and extracted potentially valuable Indication of Compromise from them. IOCs are usually posted at the bottom of technical analysis reports and used by researchers as a way to share hashes of the discussed malware samples. This information can later be used by other researchers, vendors, and SOC teams.
We then downloaded these samples from VirusTotal and from our internal databases, and gathered them all together. Overall, we began with approximately 2,500 unique samples.
Classifying классификация
When we find code similarities between two or more samples, we basically know that a sample file A shares a mutual code with another sample file B. This alone is not enough information for us, because we need to know what are A and B—are they variants or modules of the same family, do they belong to the same actor, or most importantly, are these samples a part of different families, written by different actors. In order to do this, we needed to have a clear understanding of the ascription of each sample. When taking this into practice, we tried to determine the following information about each and every sample we gathered:
- Actor—which Russian APT actor is known or probable to have written this malware (Turla, Sofacy, GreyEnergy, …)?
- Family—what is the common family name that is associated with this malware?
- Module—many malware families are built in a modular way in which a certain malware can load different payloads embedded within it or downloaded from a Command and Control server. When possible, we wanted to know whether the sample we have is a Keylogger module, a communication module, an injection module, or anything else.
- Version—some malware have a clear version stamp embedded in them. We wanted to be able to differentiate between earlier and recent versions, as well as versions that were written to different architectures and bits.
Although on the surface it looks easy, classifying turned out to be one of the most complicated parts of this research.
Starting with this frustrating fact–there is no naming standardization for malware and threat actors in the infosec industry. Every Russian APT actor and every malware family have more than a few names given to them by different vendors, researchers, and intelligence institutions. Some names will be used by different vendors to describe different families. Some malware families are described with different names by the same vendor. Other malware families simply do not have a clear name. These issues and more, made us face one of the most painful drawbacks of classification and required us to be very careful when we classify a specific piece of malware to a family and an actor.
Code Similarities сходство кода
Once we finished collecting and classifying all of the Russian APT samples, we began to cluster them based on the shared unique and malicious code between the different samples. Using Intezer’s Malware Analysis technology, we automatically disassembled and dissected each binary file into thousands of small pieces of assembly code, also referred to as “genes”. Then, for each and every gene, we checked in which software/malware it was seen previously, by referencing Intezer’s code genome database. This code genome database contains binary genes from both previously seen malicious and legitimate software, which helps us to focus on only the unique and malicious genes per file (without wasting time on shared library code, for example).
Intezer’s technology also helped us to automatically unpack samples which were packed (statically or dynamically), and to ignore the irrelevant binary parts, such as library code. Since the genome database contains all of the genes from the files that we have collected, the output of this process was an automatically generated connections graph, based on the unique Russian code, for further investigation of the results as described in the following sections.
Visualizing the Connections визуализация связей
Now that we have analyzed thousands of samples for code similarities, it is time to gather and visualize all of the identified connections in one place. Our current situation is that we essentially have two lists:
1. A list of all the samples
• Sha256, Label, Actor
2. A list of found connections
• sha256_sampleA, sha256_sampleB, # of shared genes
This is all we need in order to create an initial graph of the connections, in which every sample is a node (vertex), and a connection between two samples is an edge. We created the initial graph using the networkx library for Python and produced a .gexf file that later can be used in our favorite graph visualizer tool, Gephi.
| Gephi is an open-source interactive visualization and exploration platform for all kinds of networks and complex systems, dynamic and hierarchical graphs.
GEXF (Graph Exchange XML Format) is a language for describing complex networks structures, their associated data and dynamics. Source: Gephi website |
By loading the produced file to Gephi, we begin with a complex and crowded web of connections. In order to make it look clearer, we would need to apply some layout algorithms to it.
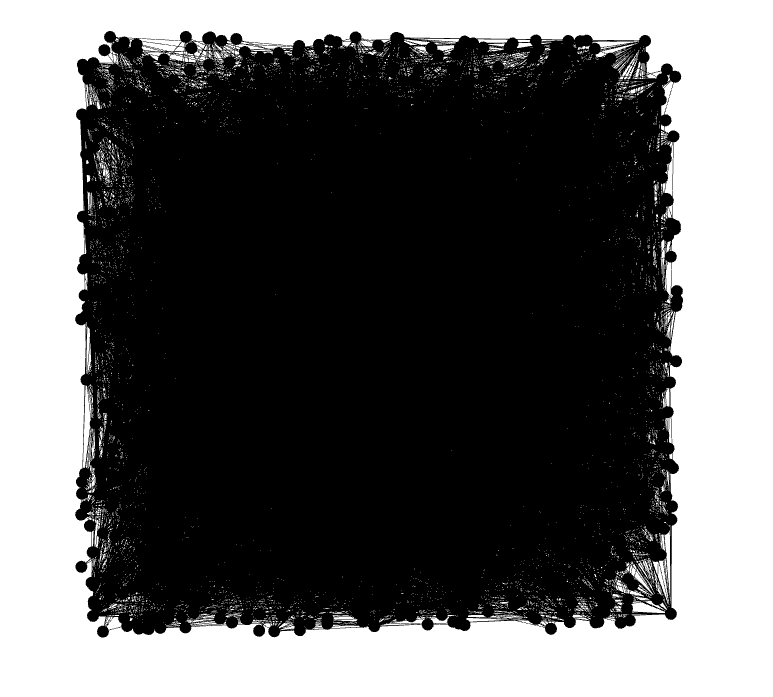
Figure 2: The initial graph as created by Gephi
Without getting too deep into Graph Theory and Graph Drawing, layout algorithms are responsible for the way that vertices and edges are arranged in the graph. This has a direct effect on the aesthetics, understandability, and usability of the graph. For our graph, we chose a Force-Directed layout algorithm, or more specifically– Fruchterman-Reingold algorithm.
Figure 3: The graph of connections after applying layout algorithms
Now we can notice some big clusters that are created and bridges between two or more clusters like this. Circular and complete-linkage clusters are most likely to be collections of samples of the same family. Two clusters that are joined together are most likely to belong to the same family (different variants) or to the same ancestry. There are many clusters, big ones, and smaller ones. The different sizes indicate the number of nodes in the cluster. This is something that can be either relevant or irrelevant depending on the situation. We need to remember, after all, a graph will present the data it was given with. Thus, the size of the cluster is directly affected by the number of samples of the same family that were in our dataset. The family may indeed be a big one, but it is possible that the samples of this family were simply more accessible for us.
Now that we have the shape of the graph, let’s add another layer—text, and colors. In our research, we want to show connections between families and actors. Thus, for each node on the graph, we will add a label with its name and a unique color per attributed actor.

Figure 4: Colors applied to the graph in order to make it more readable
Analyzing the Connections анализ связей
Now that Gephi did its magic and we have a nice, yet busy, visual graph, it is time to inspect the thousands of connections, starting from the most interesting ones, cross-actor edges.
A cross-actor edge is a line connecting two nodes that are attributed to different actors. Such a connection, when verified, can indicate that two or more actors share code.
While there are thousands of inter-family connections on the graph (a code is shared between samples of the same family) and cross-family connections (a code is shared between samples of different families attributed to the same actor), it is uncommon to see cross-actor connections.
In order to analyze the graph and its connections, we used Gephi’s Python API module. We wrote several clean-up scripts to remove and reduce false-positives and false attributions. Then, we extracted a list of connections between samples belonging to different actors.
We then moved to our favorite part, reverse-engineering the shared genes in order to verify the unique mutuality or to flag the connection as a false-positive.
A false-positive connection, in our terminology, would be a connection which is indeed true (the samples do share code), but not uniquely true. Mutually shared genes that we flagged as false-positive most-likely belong to some version of an open-source library, such as PolarSSL, B-Zip or a fork of any other open-source library.
This part required us to analyze the mutual pieces of code that were shared by two or more samples in order to understand the nature of the connection. By looking at the shared code, we could understand the goal of this code, how it is being used and in what context it was written.
In this part, we also verified that our research was able to spot and detect previously reported connections between samples and actors, be it a TTP connection or a code-connection. In some cases, we are the first to provide code-based evidence for the connections.
Interesting Connections интересные связи
Now, with the code connections graph in place, we were able to examine the interesting connections between the different Russian APTs. We have observed many connections between different tools used from the same actors, which ranged between a specific function to a whole module. Code similarities between samples of different actors were rare to find and those that we did find are not unique or large enough to indicate that code or modules were actively shared. Here are the highlights of these connections.
BlackEnergy Password Stealer <—> PinchDuke
Both share credential dumping implementation for Outlook and “The Bat!”—which is a Moldovan email client. We know that PinchDuke is based on an old credential stealer called Pinch (LdPinch) that was distributed in Russian speaking underground forums about a decade ago, and we believe that this shared piece of code between BlackEnergy and PinchDuke has originated from the Pinch source code. Not only that several functions are mutual, but there are also mutual strings—as can be seen in the screenshots below.
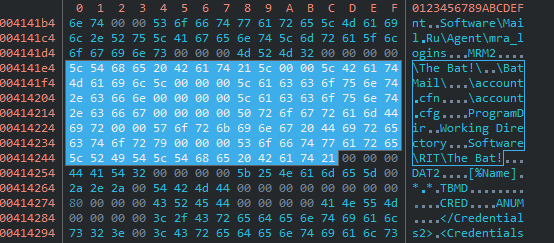
Pinch Duke [0ce3bfa972ced61884ae7c1d77c7d4c45e17c7d767e669610cf2ef72b636b464]
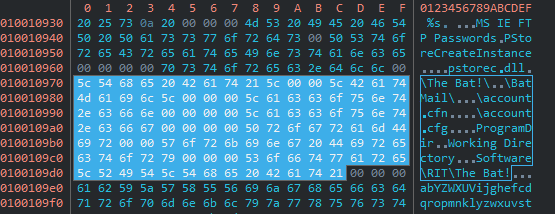
Black Energy [3cf46c68dccb989fbda3f853cc19025d39d38d9ea5786f4ae6a926677d6c5f62]
BlackEnergy <—> Energetic Bear
As published by McAfee, we also observed identical self-delete functions between BlackEnergy sample from 2015 and the newer Energetic Bear (Dragonfly) sample from 2017. Despite the fact that self-delete functions are pretty common in malware, it is rare to see an exact 1:1 match in the binary level, which matches only for these two malware families out of all the malware families indexed in Intezer’s Genome Database. We believe that this function was not actively shared between these actors, but instead, was taken from a public source.
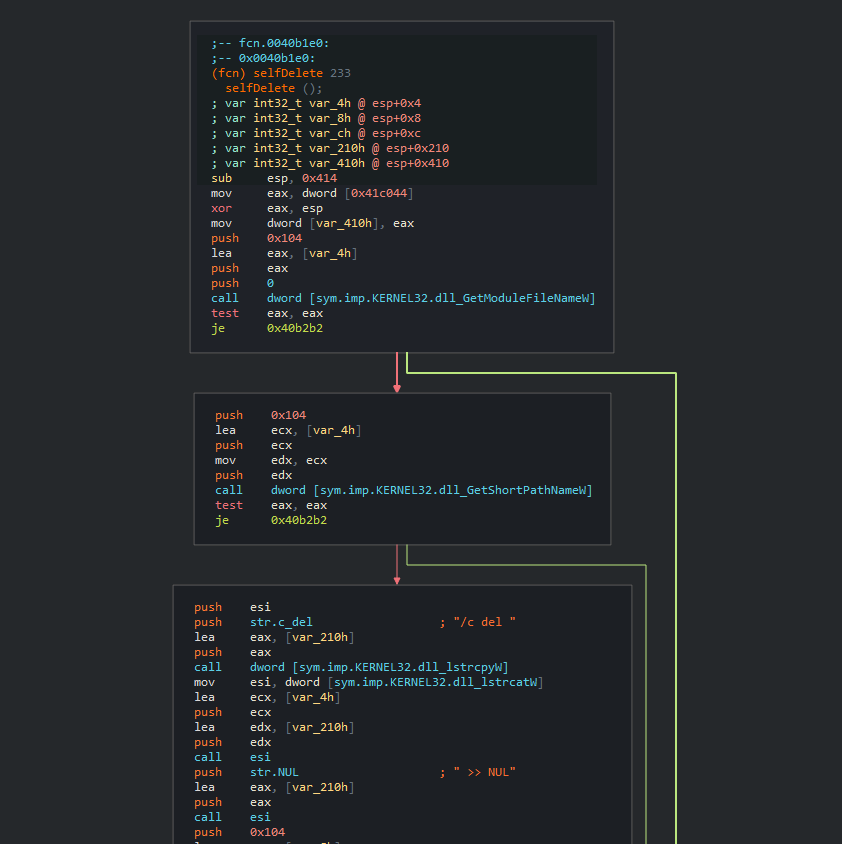
Black Energy [11b7b8a7965b52ebb213b023b6772dd2c76c66893fc96a18a9a33c8cf125af80]
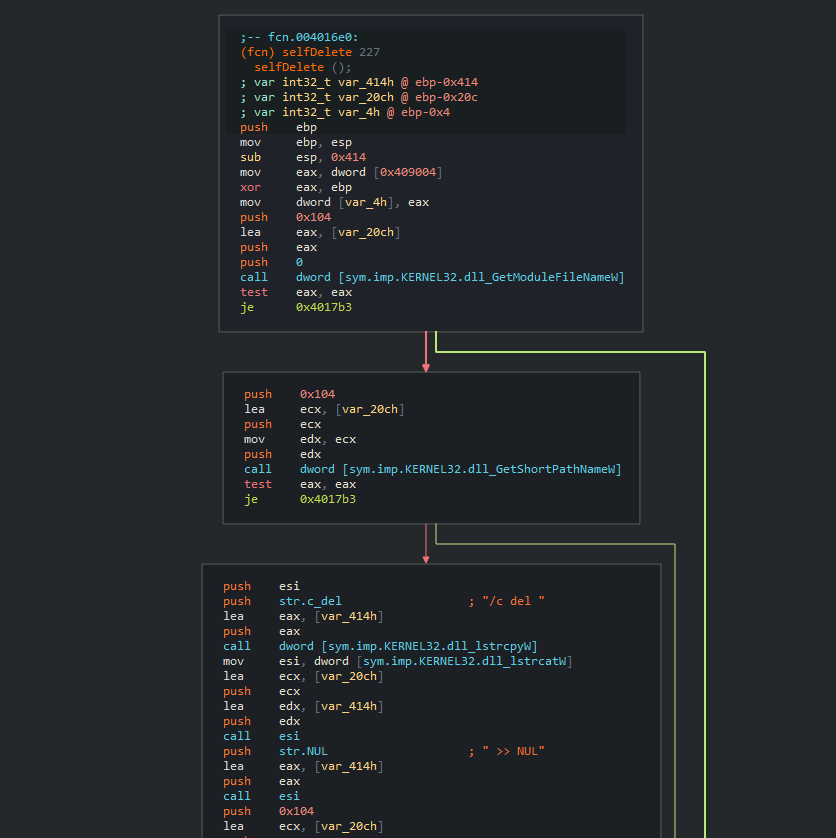
Energetic Bear [fc54d8afd2ce5cb6cc53c46783bf91d0dd19de604308d536827320826bc36ed9]
Potao Main Module <—> X-Agent
Both Potao’s main module sample from ESET’s publication and X-Agent sample which was uncovered by USCYBERCOM share slightly similar PE Loader implementation. Due to the low percentage of shared code, we cannot call if it was originated from a shared codebase or simply a generic implementation of a PE loader function.
Industroyer <—> Exaramel
As published by ESET we also observed similar code connecting Exaramel backdoor used by TeleBots group to Industroyer’s main backdoor component, which suggests Exaramel is a newer version of this backdoor.
Tools тулзы
We are happy to conclude the results of our research into two open-source accessible tools. These tools can be an asset for any researcher and security teams that will investigate or research Russian-related attacks.
Russian APT Map
The Russian APT map is a web-based, interactive map that shows the different families and actors that are part of the Russian APT ecosystem, as well as the connections between them. The map is basically a one-stop-shop for anyone who is interested to learn and understand the connections and attributions of the samples, modules, families, and actors that together comprise this ecosystem.
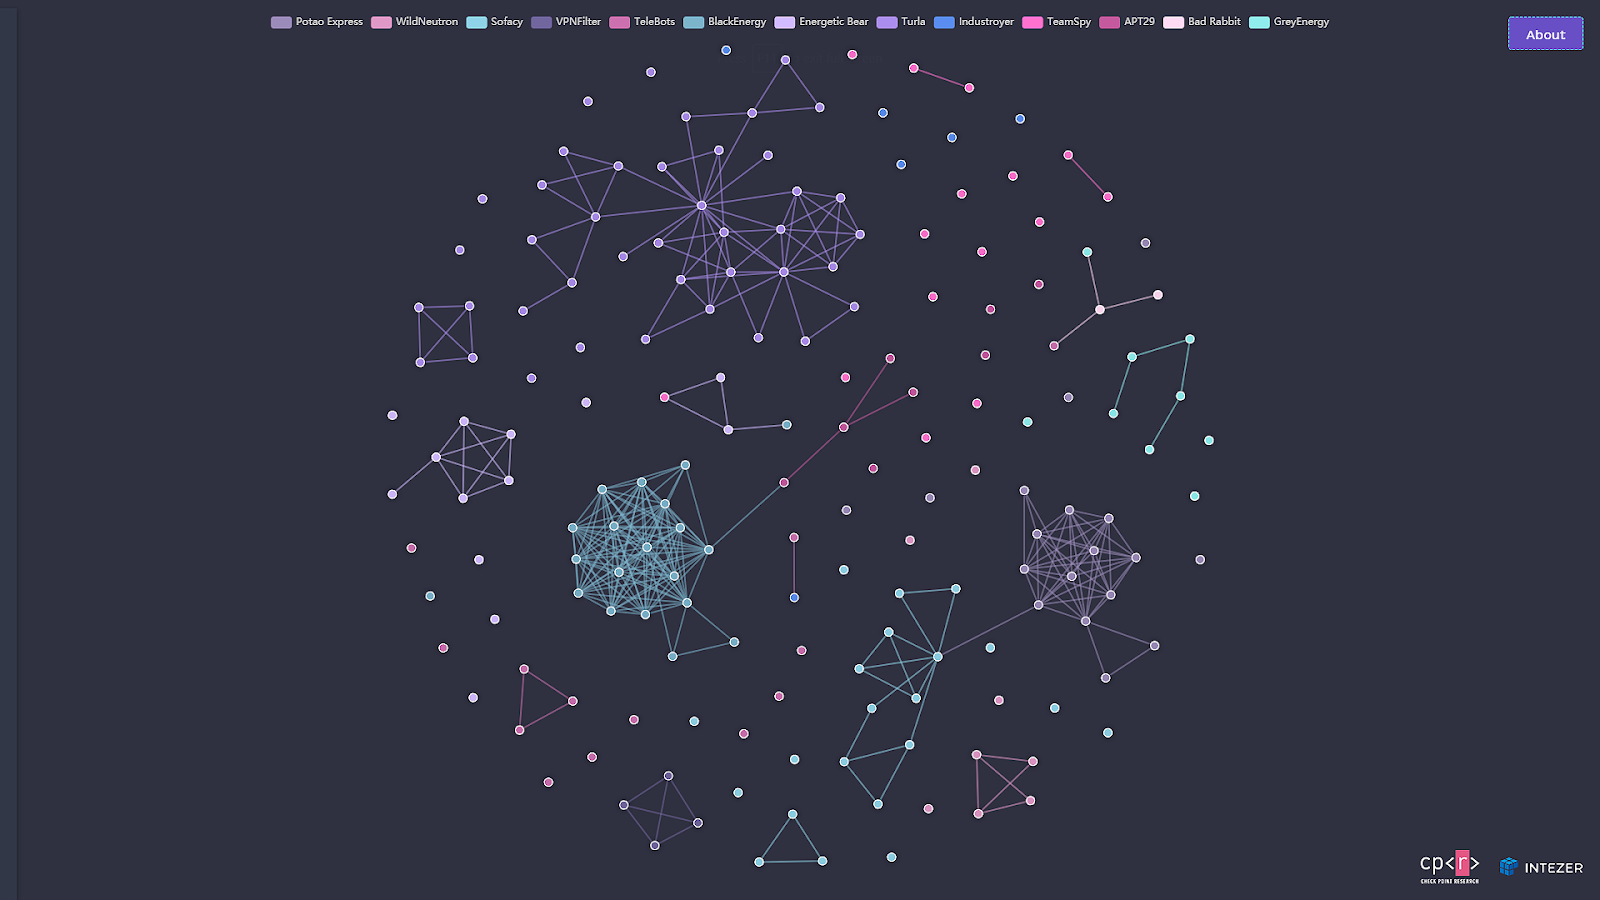
Figure 5: The map we created to show the connections inside the ecosystem
The map is intuitive and rich with information. The user can get a full overview of the ecosystem or drill down into specific connections. By clicking on nodes in the graph, a side panel will reveal, containing information about the malware family the node belongs to, as well as links to analysis reports on Intezer’s platform and external links to related articles and publications. Basically, this side-panel is a short identity-card of the entities on the map.
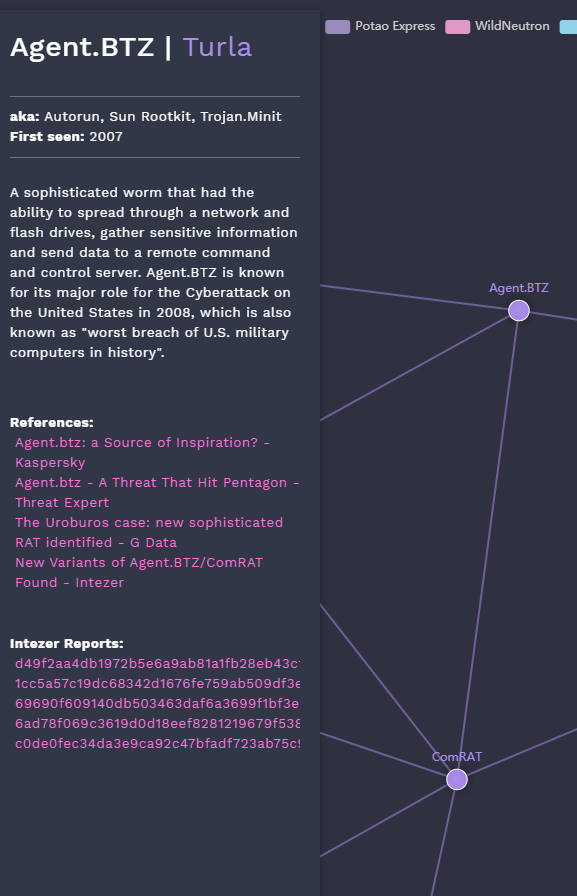
Figure 6: A side panel with additional information about the nodes
The map and its data are available open-sourced in our repository and we are inviting you all to add more information and improve it.
Click here to open: Russian APT Map
APT Scanning Tool
Having access to more than 3.5 million pieces of code that were shared between the Russian APT samples we gathered, allowed us to understand which unique genes are popular and more likely to be shared between samples, families, and actors. We used this knowledge to write a tool that can be used by organizations, CERT teams, researchers, and individuals to scan a specific file, a folder, or a whole file system, and search for infections by Russian APTs.
The tool, which we named Russian APT Detector, is a set of YARA rules produced by Intezer’s platform. The rules contain byte-sequences of popular mutual code between one or more samples. We then wrapped it up in a binary to ease the use of the tool. The full ruleset can be found in our repository, and can be used freely using your favorite YARA scanner. Don’t hesitate to integrate this ruleset into your platform and toolset.
Click here to get: Russian APT Detector
Results pезультаты
As far as we know, this was the first time that research of this kind, size, and comprehension was done. Using publicly known information we were able to gather, classify, and analyze thousands of samples attributed to one of the most active and advanced cyber-espionage ecosystems, Russia. Throughout this research, we analyzed and investigated dozens of potential pieces of code-based evidence that may indicate that code was shared between different Russian military, government, and intelligence entities.
The connections we analyzed clearly showed that pieces of code such as functions, whole or partial module and, encryption schemes were shared between different teams and projects of the same actor. That means that different malware families of the same organization are sharing such code. This information may suggest that different teams, belonging to the same organization, are aware of each other’s work and operations. By sharing code with each other, the teams can save hundreds of man-hours and a lot of money. Instead of re-implementing capabilities that already exist, the teams can focus on other things and re-use the code. Another benefit of using an existing code is that most likely, the code was tested in real-life cyber operations and the team that developed it had an experience of using and improving it. On the other hand, the price of sharing and re-using code is that when it gets caught by a security vendor or researchers, the shared pieces of code can be used to find new samples and families that are using the code. Thus, one detected family can make more operations fall apart.
Interestingly, our analysis and observations demonstrate that when it comes to cross-actor connections, in the vast majority of times, different actors do not share code. None of the connections we analyzed indicated that some pieces of code are shared between two or more organizations. We find it very interesting and unexpected. While we cannot know for sure what brought the organizations in the Russian APT ecosystem to not share code with one another, we can make some hypotheses.
A reasonable option can be that Russia, having one of the most advanced and strong cyber-espionage capabilities, is aware of the disadvantages of code-sharing that we listed above. By avoiding different organizations re-using the same tools on a wide range of targets, they overcome the risk that one compromised operation will expose other active operations, preventing a sensitive house of cards from collapsing. According to this assumption, Russia is willing to invest an enormous amount of money and man-power to write similar code again and again, instead of sharing tools, libraries or frameworks, causing redundancy in this parallel activity. If this is true, this can indicate that operational security has a priceless meaning for the Russian actors.
Another hypothesis is that the different organizations do not share code due to internal politics. Since we are not familiar enough with the politics and the relationships between Russia’s intelligence organizations, this hypothesis should be taken with caution. After the dissolution of the Soviet Union, KGB’s SIGINT unit was succeeded by other special service organizations such as FSB and SVR. In addition to the successors of KGB’s signal intelligence functions, there is another organization, The Main Directorate of the General Staff of the Armed Forces of the Russian Federation, or in short—GRU. Out of these special services, the GRU likely possesses the finest technological and operational capabilities. Sharing the responsibility for cyber-espionage operations between several groups (which is not rare) might cause problems such as miscommunication, redundant work, duplicate targets, and ego.
As briefly mentioned earlier, our research confirmed connections that were previously found by other security vendors. Some of these connections were proved before and others were only suspected. We are now able to back these claims with code-based evidence, such as Industroyer – TeleBots code connections discussed previously.
Finally, we concluded our research into two tools that we are publicly sharing with the research community. The Russian APT Map and the Russian APT Detector are thoroughly described in previous chapters in this article.
Acknowledgments благодарности
We want to thank our team leaders, Mark Lechtik and Ari Eitan, for accompanying us in this research, for helping us a lot and for always giving interesting and important insights. We would also like to thank our colleagues from ESET for providing some of the samples. And last but not least is our colleague Paul Litvak, who helped us with completing the APT Detector tool.